SWARM Data Activity #4
Seeing with Sound in the Palmer Deep
You can also download this activity as a Word Doc: Data Swarm Activity #4.
In the last dispatch, underwater glider data revealed the temperature, salinity and chlorophyll levels below the surface of the water in the penguin foraging area. Krill and other small zooplankton feed on the chlorophyll. The krill are then eaten by the penguins. This week we are going use echosounders (acoustics) to locate krill in the Palmer Deep.
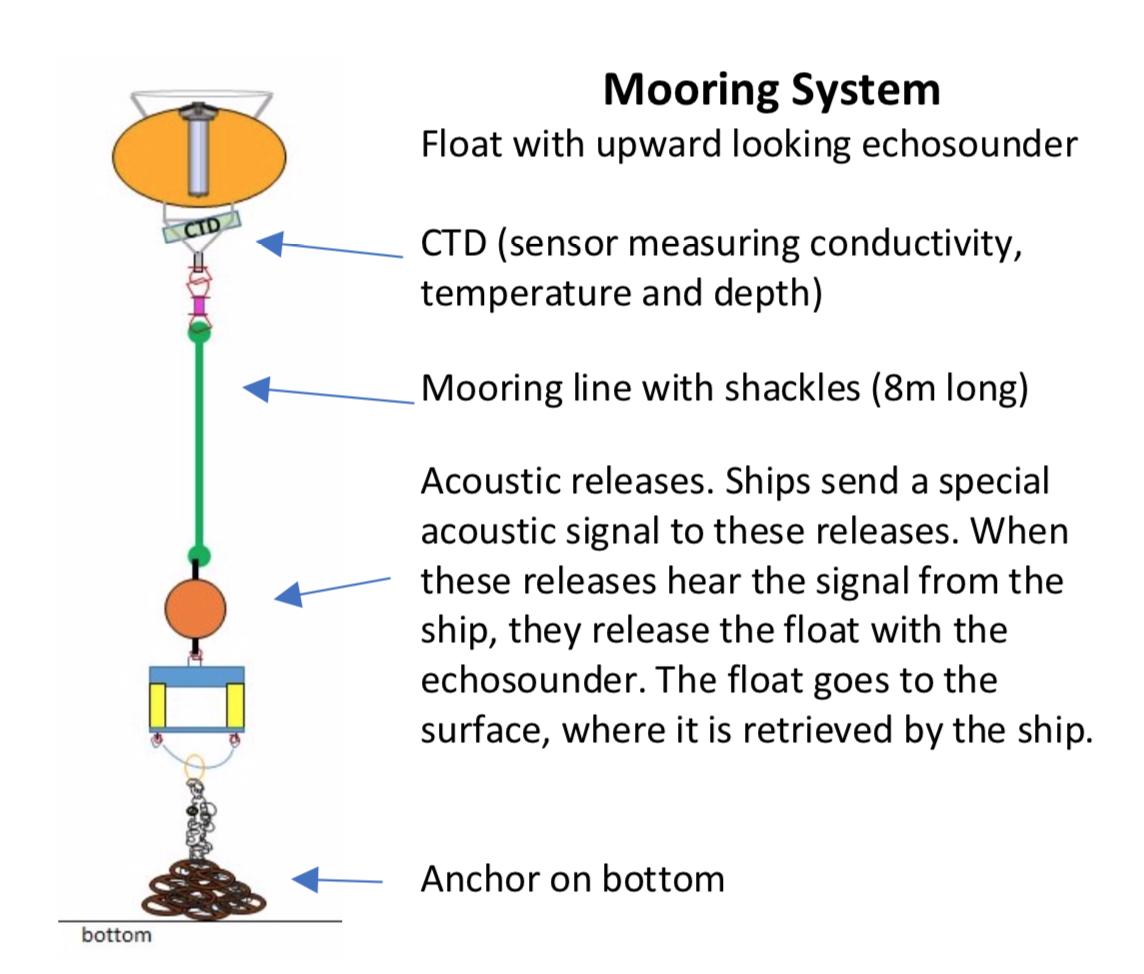
How does a mooring work?
SWARM scientists have deployed three mooring systems in the Palmer Deep area. Each mooring system has a mooring line anchored to the ocean floor and connected to an echosounder and float. The float lifts the echosounder above the sea floor and points it toward the surface. The echosounder is housed in the float, and is suspended off the sea floor. The echosounder depth is about 350 meters deep, and sends acoustic signals toward the surface. Moorings are used for keeping equipment at consistent depths in the water column.
How do we know where the krill are?
Krill are between 1 and 5 cm long. They are big enough to swim, but also small enough to get pushed around by ocean currents.
Echosounders emit sound waves that reflect off krill and other underwater animals. The echosounders detect the soundwaves that have been reflected to tell how far away the krill are. Using acoustics is an effective way to measure abundance of krill in the ocean. The mooring records the acoustic signal of anything reflecting sound (especially krill) every 6 seconds! Krill often appear as “swarms” with very high acoustic scattering in the upper 100m of the water.
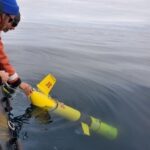
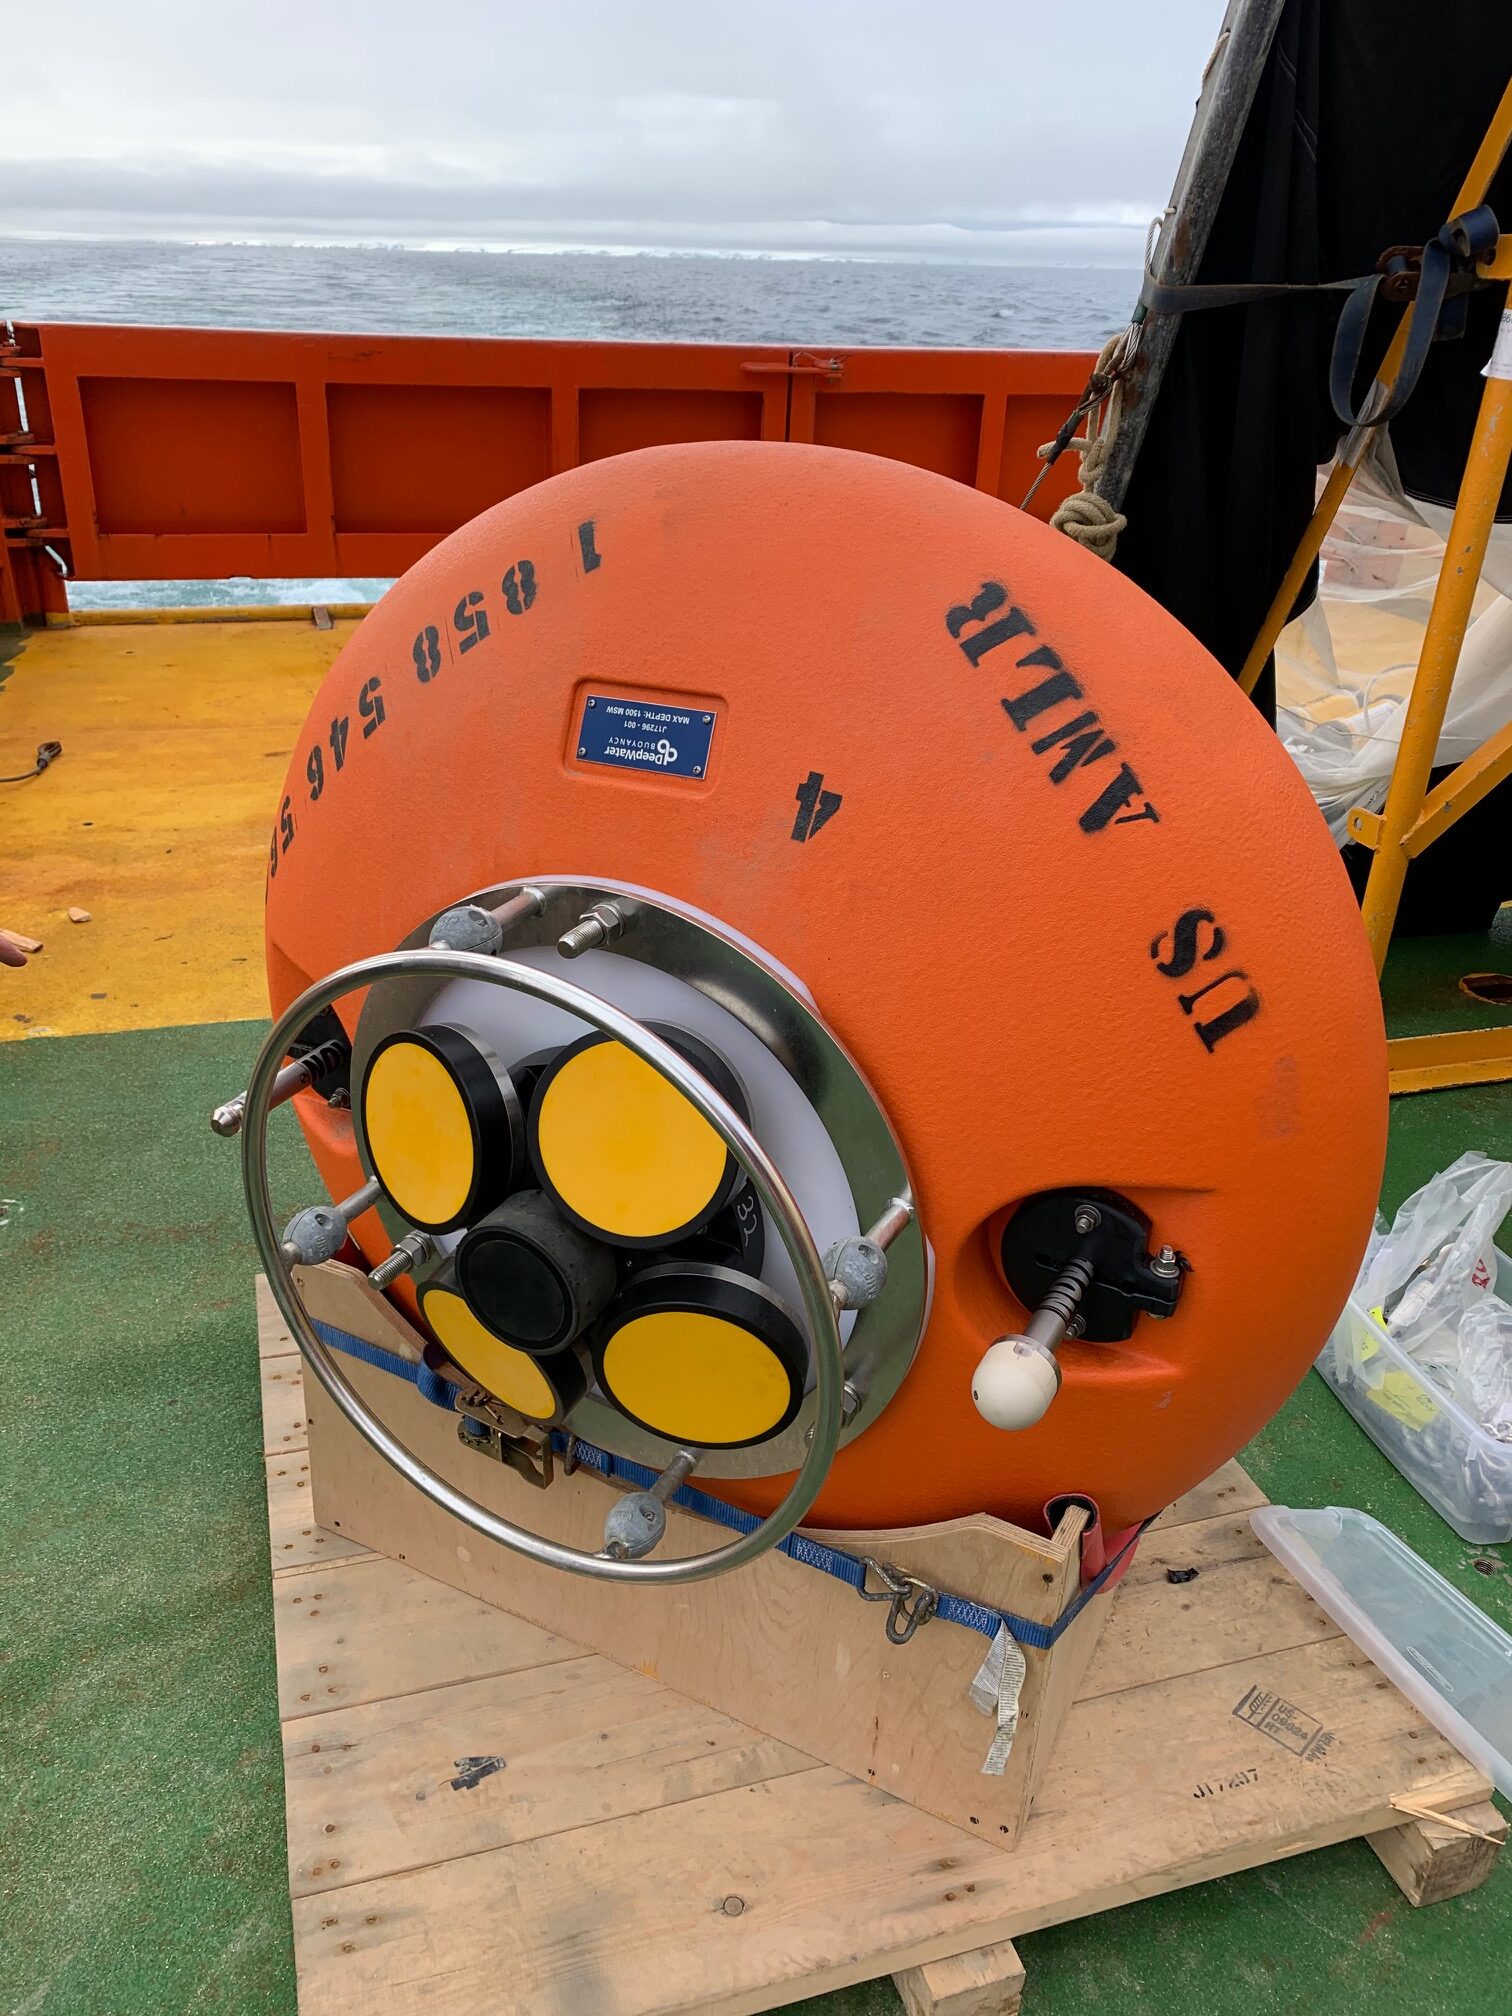 Float with embedded ecosounder on deck. |
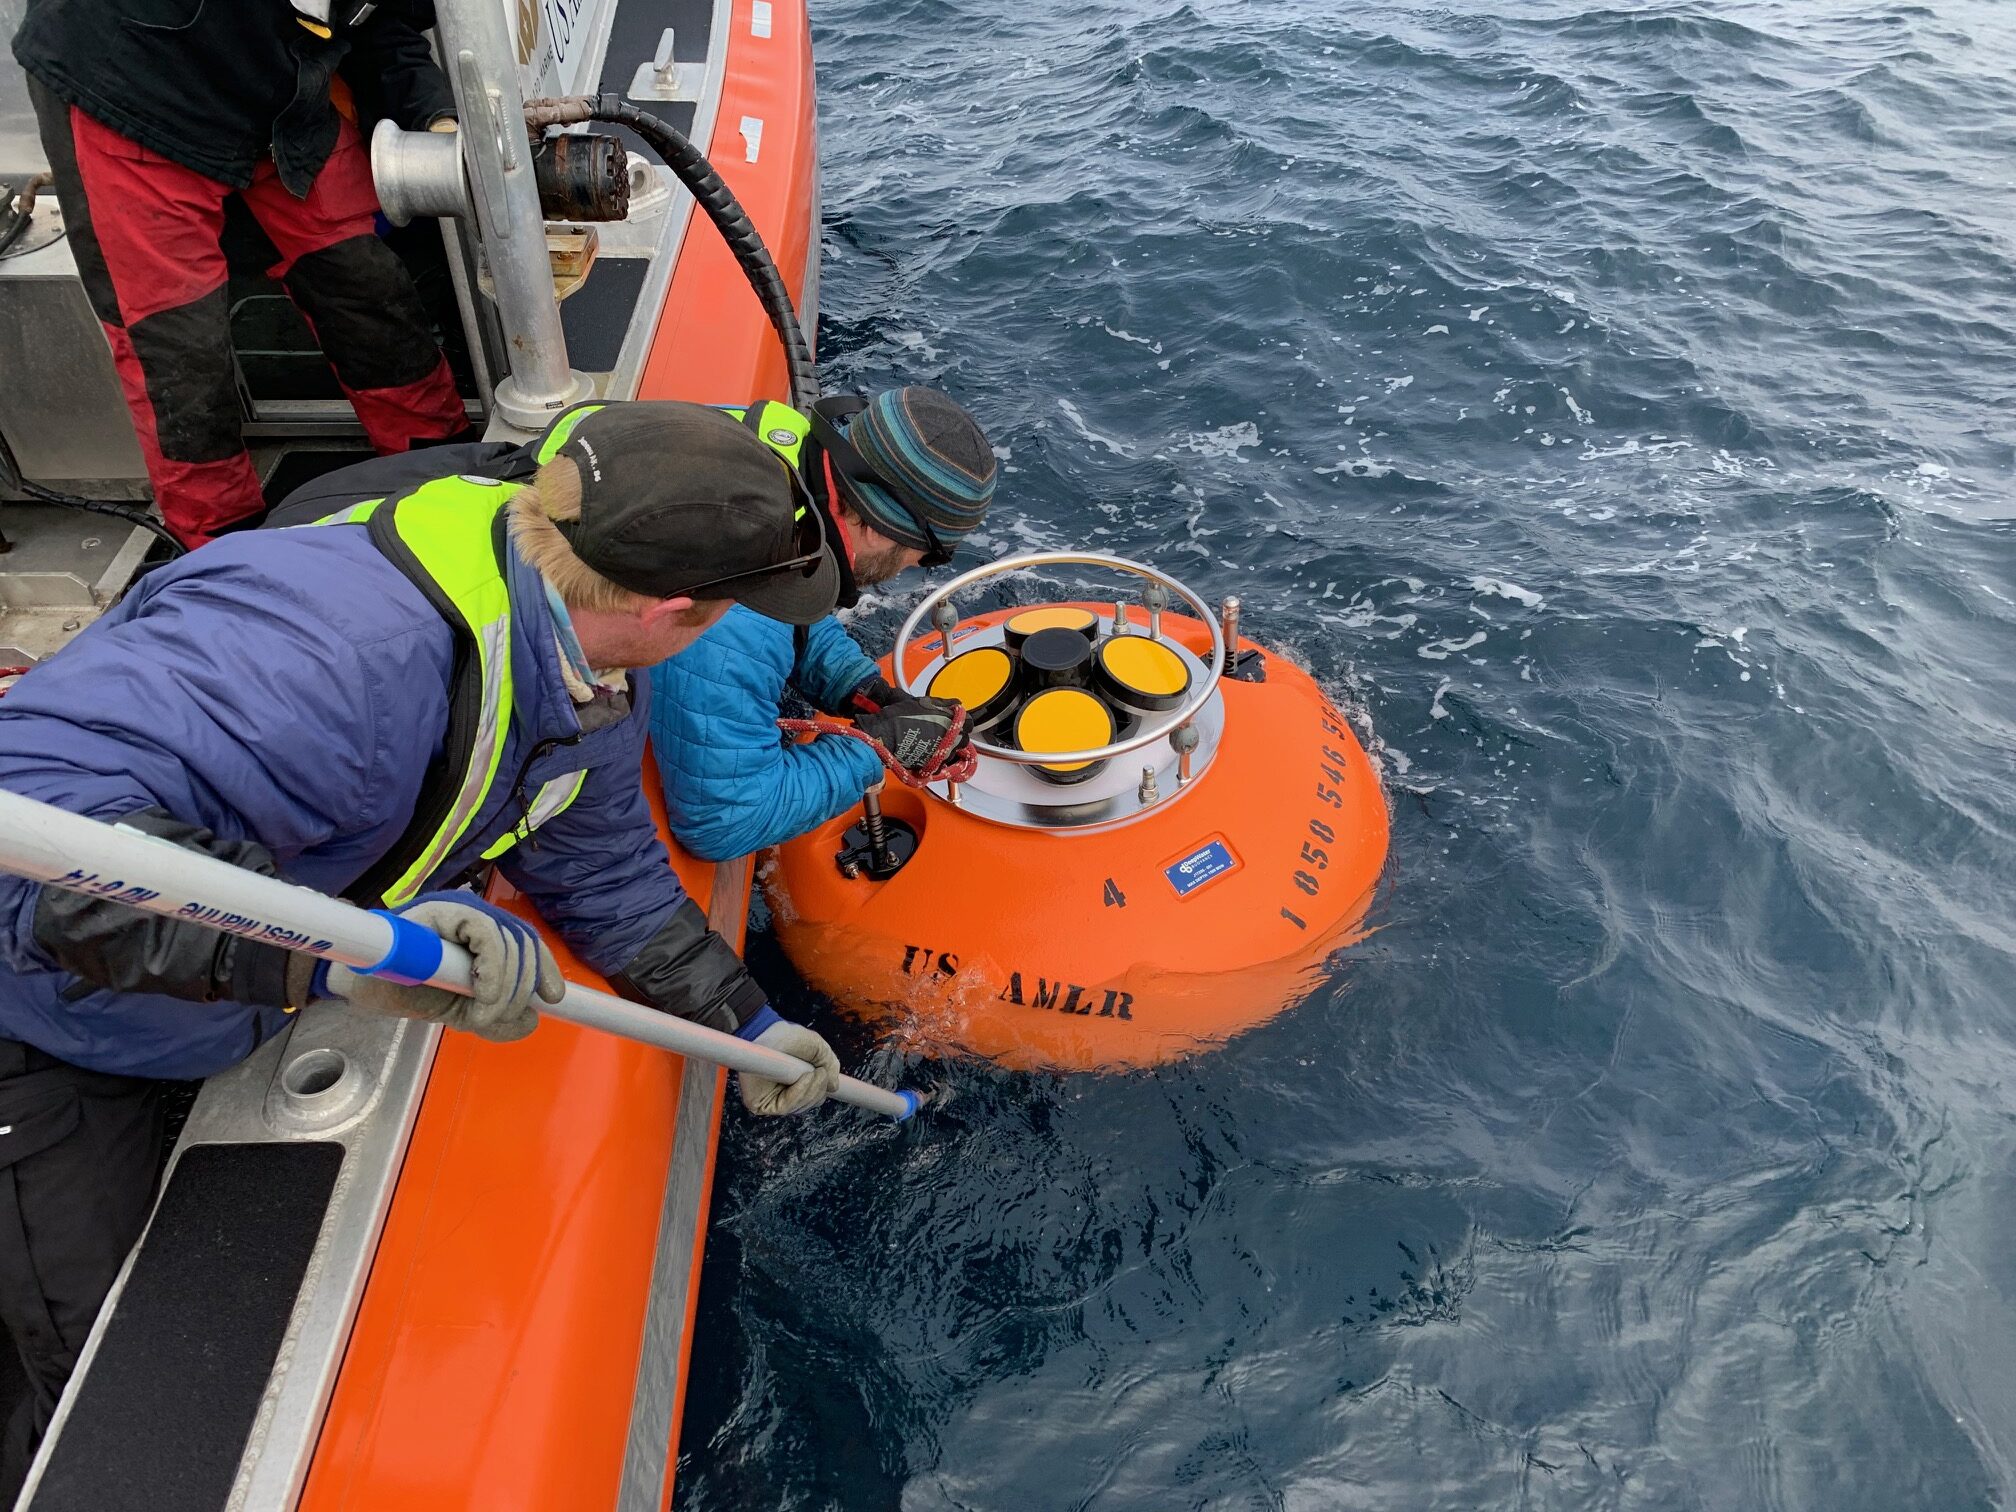 Recovery of echosounder float. |
Data Activity
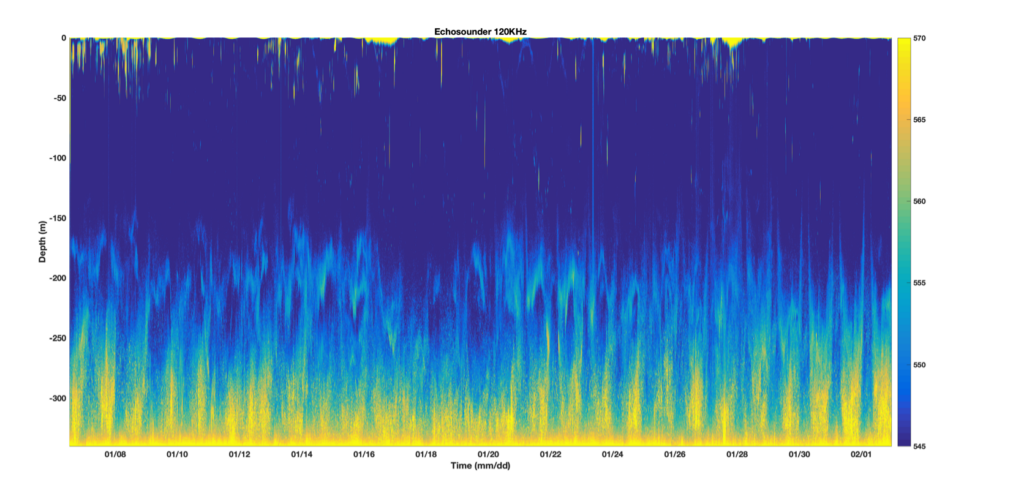
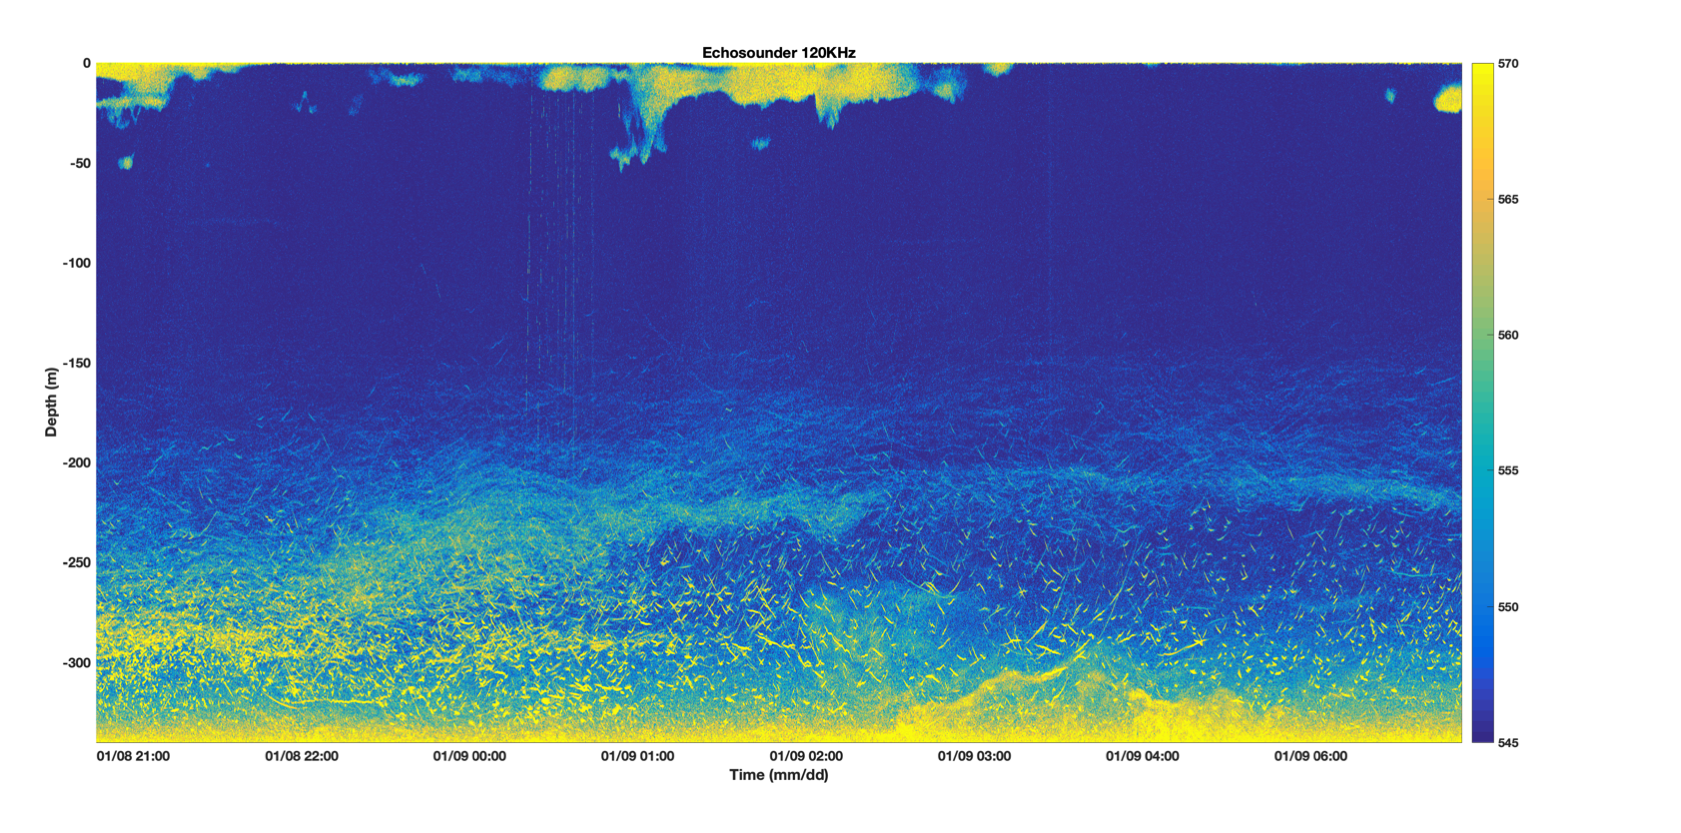
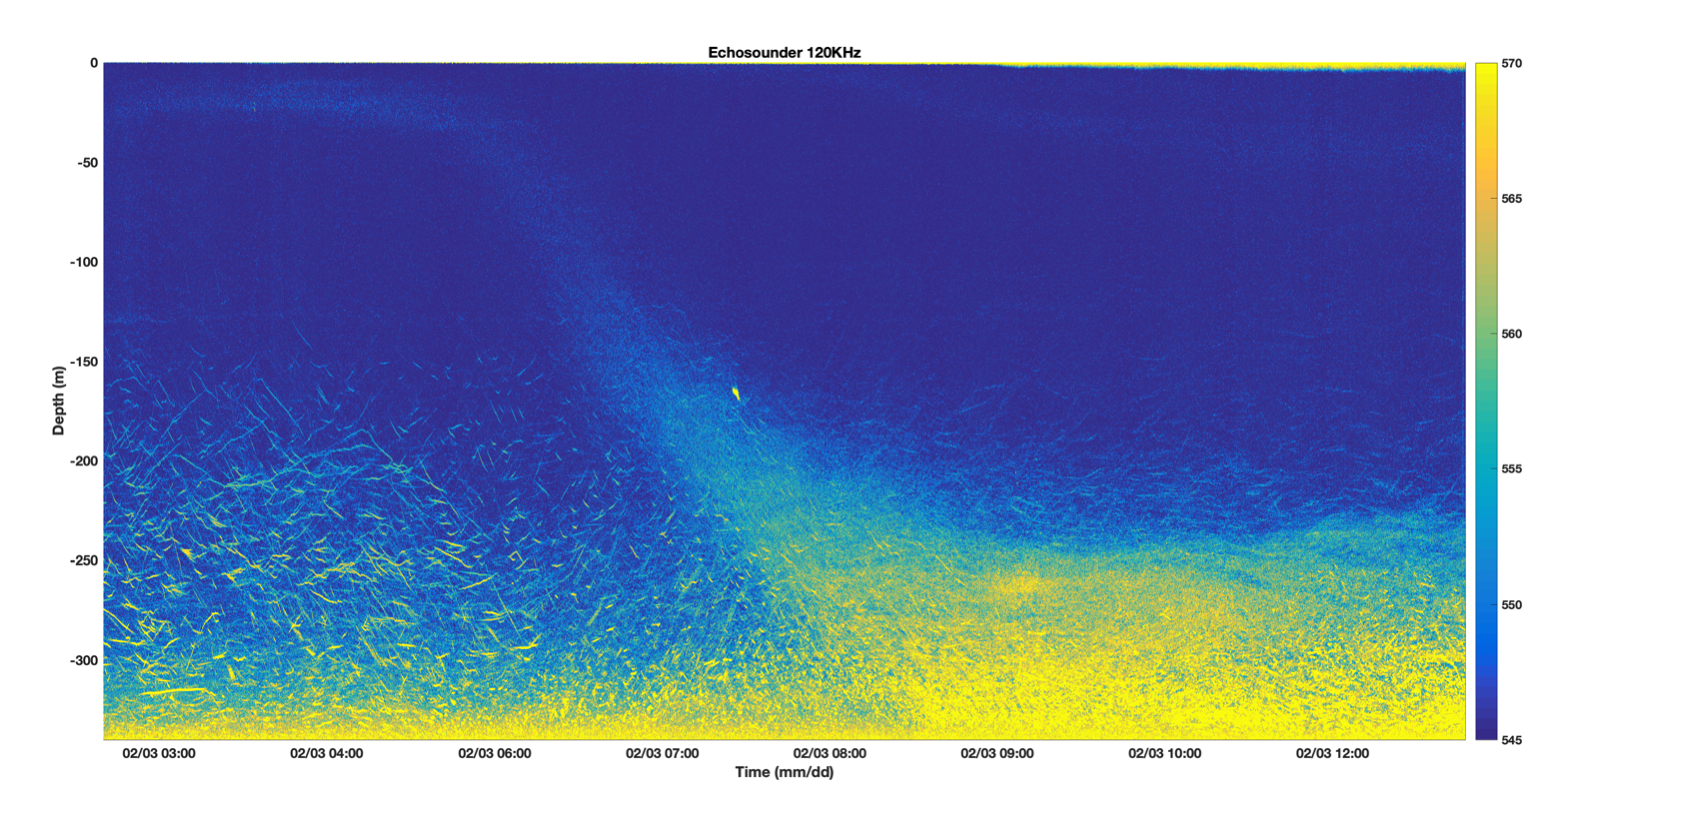
Below are echosounder data sets. The data sets are a profiles of the water column, from the bottom where the mooring is anchored up to the surface of the ocean. The first graph is the echosounder time series from a mooring. It was deployed, surface looking, in 350 meters of water from January 7th to February 3rd. The next two graphs are zoomed into 12 hour sections of this dataset. The scale on the right is a relative scale. 570 (yellow) is a high return value and 545 (blue) is a low return value. Krill are high returns near the surface.
Review the mooring data collected from the Palmer Deep and answer the following questions:

1. In the first plot (January 7th to February 3rd), which dates do you see the highest acoustic returns at the surface?
2. The second plot focuses in on 10 hours of data collected from the mooring from January 8th into January 9th. Looking at krill returns near the surface in the first two plots, how frequently do krill swarm at the surface? Hourly? Daily? Weekly? Monthly? Rarely?
3. The third plot shows data collected on the last day of the deployment (February 3rd). In addition to krill, there are smaller zooplankton communities that move from the surface of the ocean toward the bottom and back again during the day. This daily vertical movement is called diel vertical migration. What hours of the day are the smaller zooplankton closer to the surface? Closer to the bottom?
4. How many meters do the phytoplankton move from the surface to the bottom? How long does it take them to complete this migration?
This activity was developed as part of our Project SWARM series of data activities.