Location: Jacques Cousteau Coastal Education Center, Tuckerton, NJ
What to Bring
Preparation
- Explore data portals and provided data set
Monday, August 12 – Day 1
| Time |
Topic, Objectives, & Activities |
| 5–8:30pm |
Icebreaker Activity: Polar Challenge (Oliver and McDonnell)
Dinner
Orientation to the Study Site (Oliver and Kohut)
- What are the scientific goals of SWARM?
- What are the educational goals of SWARM and Polar CAP?
- Integration of the Polar Literacy Principles (Hotaling and McDonnell)
|
Tuesday, August 13 – Day 2
| Time |
Topic, Objectives, & Activities |
| 7:00am |
Breakfast |
| 8:30am |
Welcome Back (McDonnell)
Participants share (5 minutes each)
- Why did you apply for this workshop?
- Based on your background, what do you want to get out of this experience?
- Based on your experience, what are the benefits/challenges of teaching with data based on your experience?
|
| 9:30am |
SWARM Research Overview
Physical Oceanography (Kohut)
- Link to Slides
- Activity: Codar data set
- Activity: Glider data set
- Activity: T/S diagram/density tanks
Systems Thinking/Conceptual Model Activity (Ferraro)
|
| 10:30am |
Break |
| 10:45am |
SWARM Research Overview
Biological Oceanography (Oliver)
|
| 12:15pm |
Lunch |
| 1:00pm |
Observational Data and Modeling (Mike)
|
| 2:00pm |
|
| 3:00pm |
Discuss how we Develop and Refine Testable Questions |
| 3:15pm |
Break |
| 4:30pm |
Introduction to Team Kriller
|
| 5:30pm |
Break for Day |
| 6:30pm |
Dinner at local restaurant |
Wednesday, August 14 – Day 3
| Time |
Topic, Objectives, & Activities |
| 7:00am |
Breakfast |
| 8:30am |
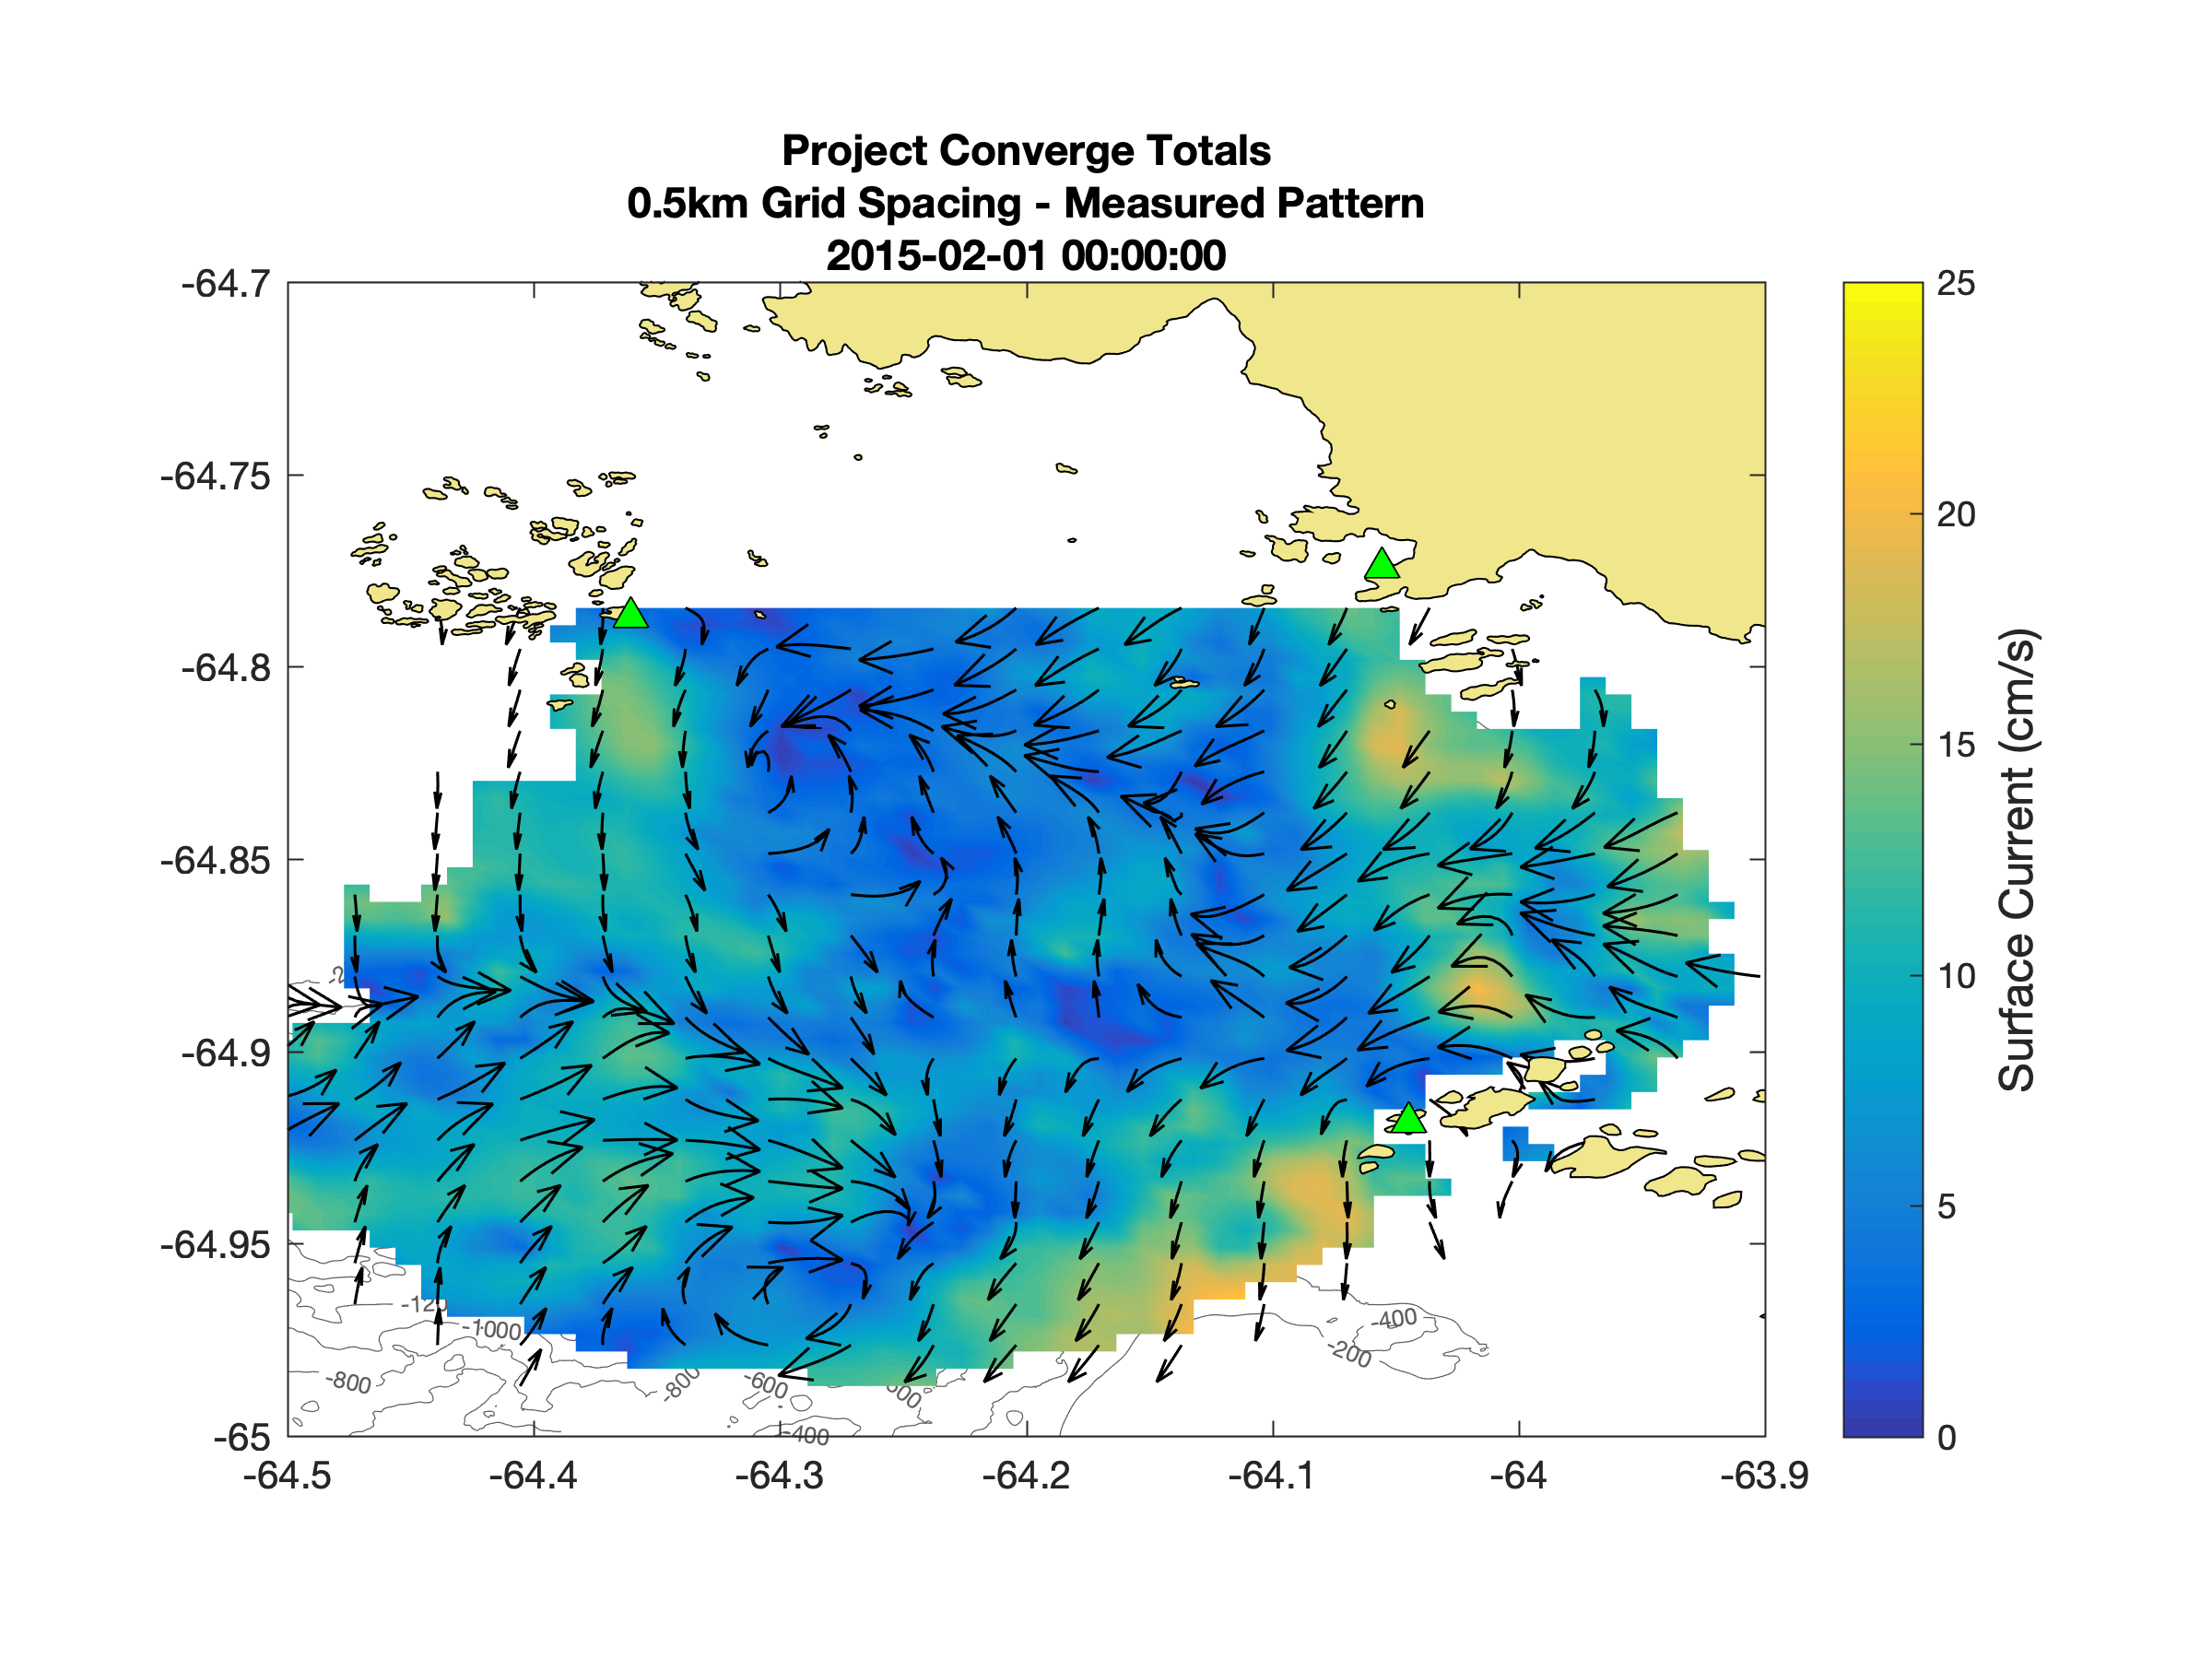
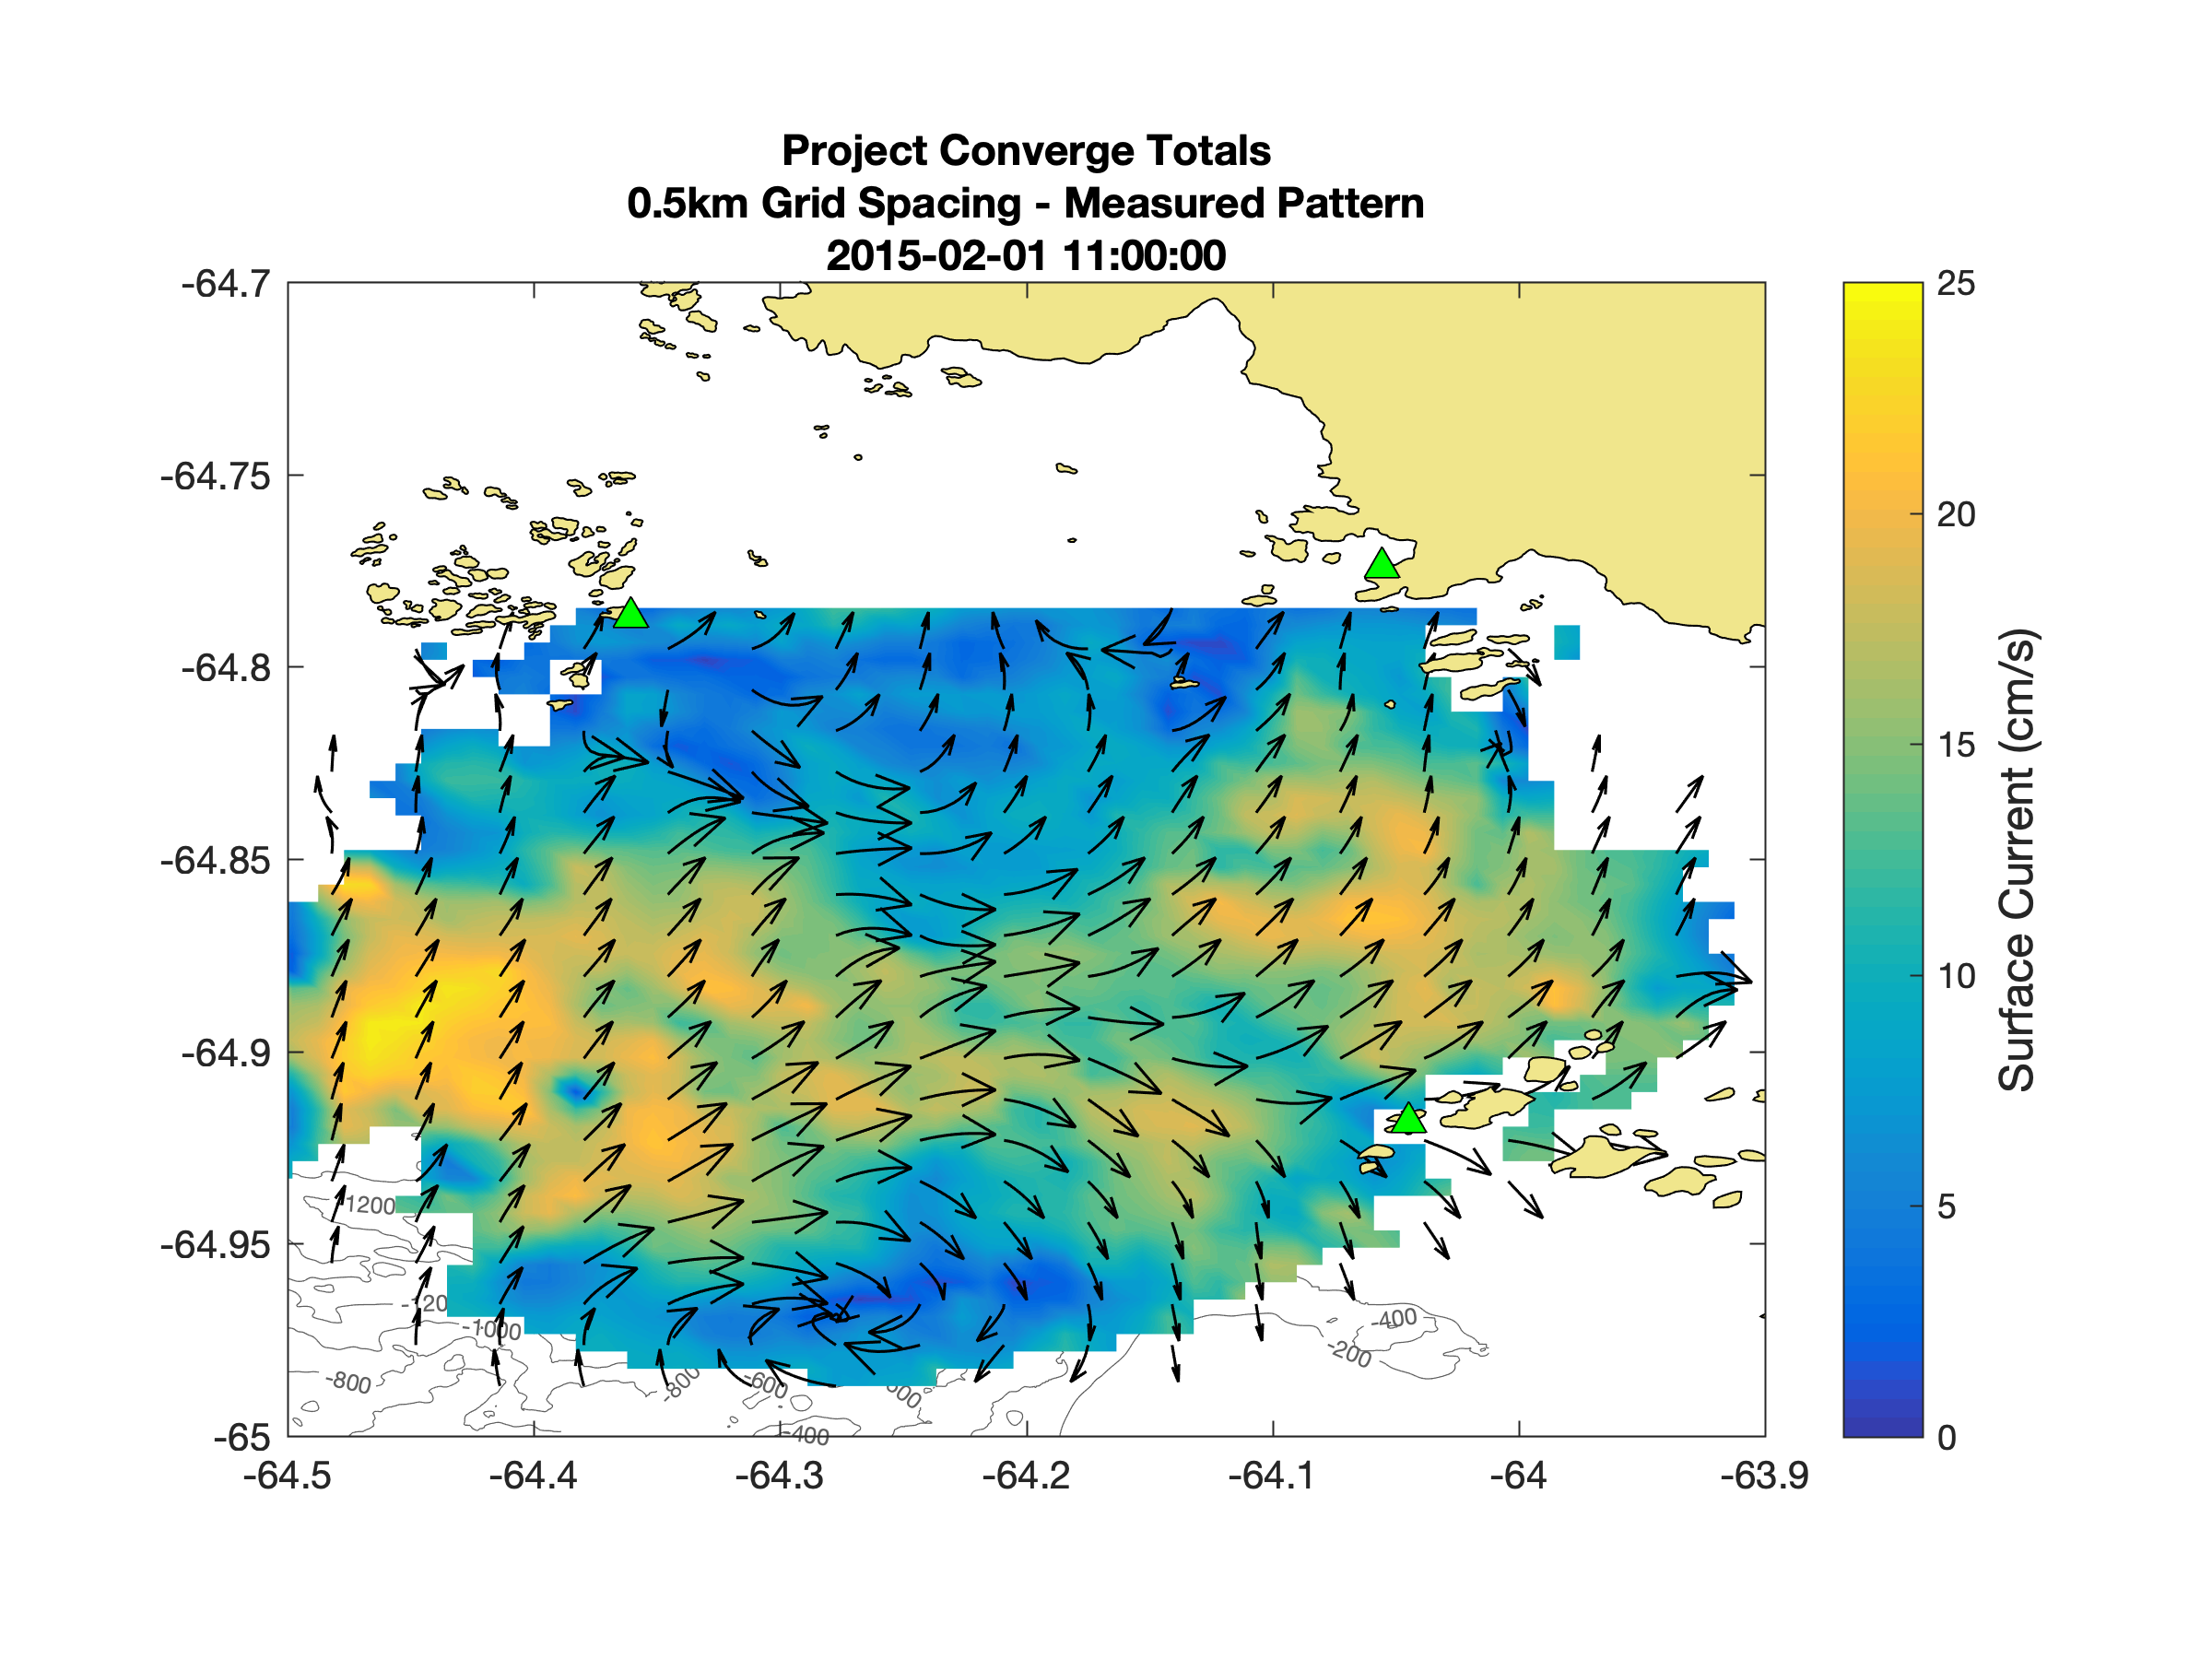
Welcome Back / Dive into Data / Station rotation
- Static in time/changing in location (HF Radar data set)
- West Antarctic Peninsula (Off Palmer Station) on February 01, 2015 at 0000 GMT – Data File – Image File
- West Antarctic Peninsula (Off Palmer Station) on Feb. 01, 2015 at 1100 GMT – Data File – Image File
- Changing in time/static in location (Glider data)
- 2015_Palmer_Glider_0-10m is a time series record of oceanographic conditions averaged over the top 10m at the stationary glider in 2015.
- 2015_Palmer_Glider_80-90m is a time series record of oceanographic conditions averaged over the top 10m at the stationary glider in 2015.
- Changing in time/changing in location (Historical penguin data)
- West Antarctic Peninsula model output
|
| 10:30am |
Break |
| 11:00am |
Work Session (scientists/educators brainstorm)
- Decide what science question to address and ideas for how to address the question with data provided.
- Report out. How do see using the data in your classroom? What are the additional tools we need to work with the data with our students?
|
| 12:00pm |
Lunch |
| 1:30pm |
SWARM Action Planning
|
| 2:15pm |
Action Planning with workgroups |
| 3:00pm |
Break |
| 3:30pm |
Engagement Planning
- What can we do to expand the pool of teachers and students involved in SWARM?
|
| 5:30pm |
Break for Day |
| 6:30pm |
Dinner – evening work session if needed |
Thursday, August 15 – Day 4
| Time |
Topic, Objectives, & Activities |
| 8:30am |
Breakfast |
| 9:00am |
Presentations from teachers
- How will you use SWARM data in your classroom during the 2019-20 school year include: a) number of students you plan to engage; b) how will you engage others in the SWARM project?
|
| 12:00pm |
End of program |