The Art of Storytelling – Part 1: The Brain
 In the summer of 2015, I went on a reporting trip to Greenland and Iceland that was sponsored by the Pulitzer Center on Crisis Reporting. I’m going to use the stories that resulted from that trip to discuss some of what I think about when I tell a science story. Let’s start with the first few minutes of a radio story that I produced for PRI’s The World:
If you want to hear more, the full story can be found here.
Another way I might present the same information that I just described in that radio story is to show you this paper of Gordon Hamilton’s where he writes:
“The coastal portions of Kangerdlugssuaq and Helheim glaciers in southeast Greenland lost at least 51 ± 8 km3 yr−1 of ice between 2001–2006 due to thinning and retreat…”
And includes the following figure, in which redder means a larger change in glacial height:
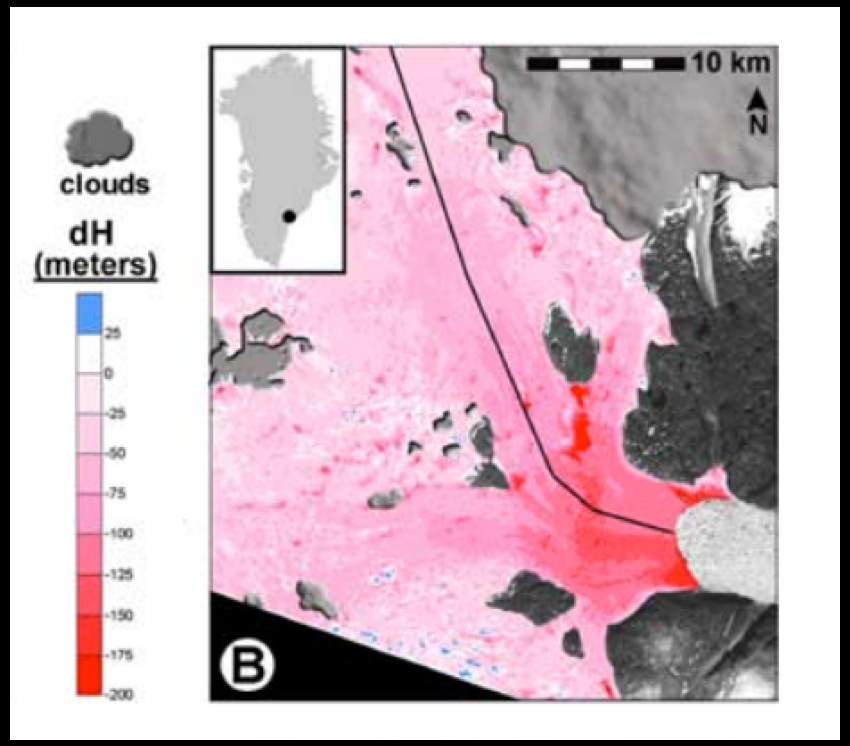
Figure 3B: Rapid volume loss from two East Greenland outlet glaciers quantified using repeat stereo satellite imagery (Geophysical Research Letters, Volume 34, Issue 5, L05503, 14 MAR 2007 DOI: 10.1029/2006GL028982)
Then, I could show you the paper of Fiamma Straneo’s entitled Impact of fjord dynamics and glacial runoff on the circulation near Helheim Glacier and point to Figure 2A that shows depth as a function of temperature:
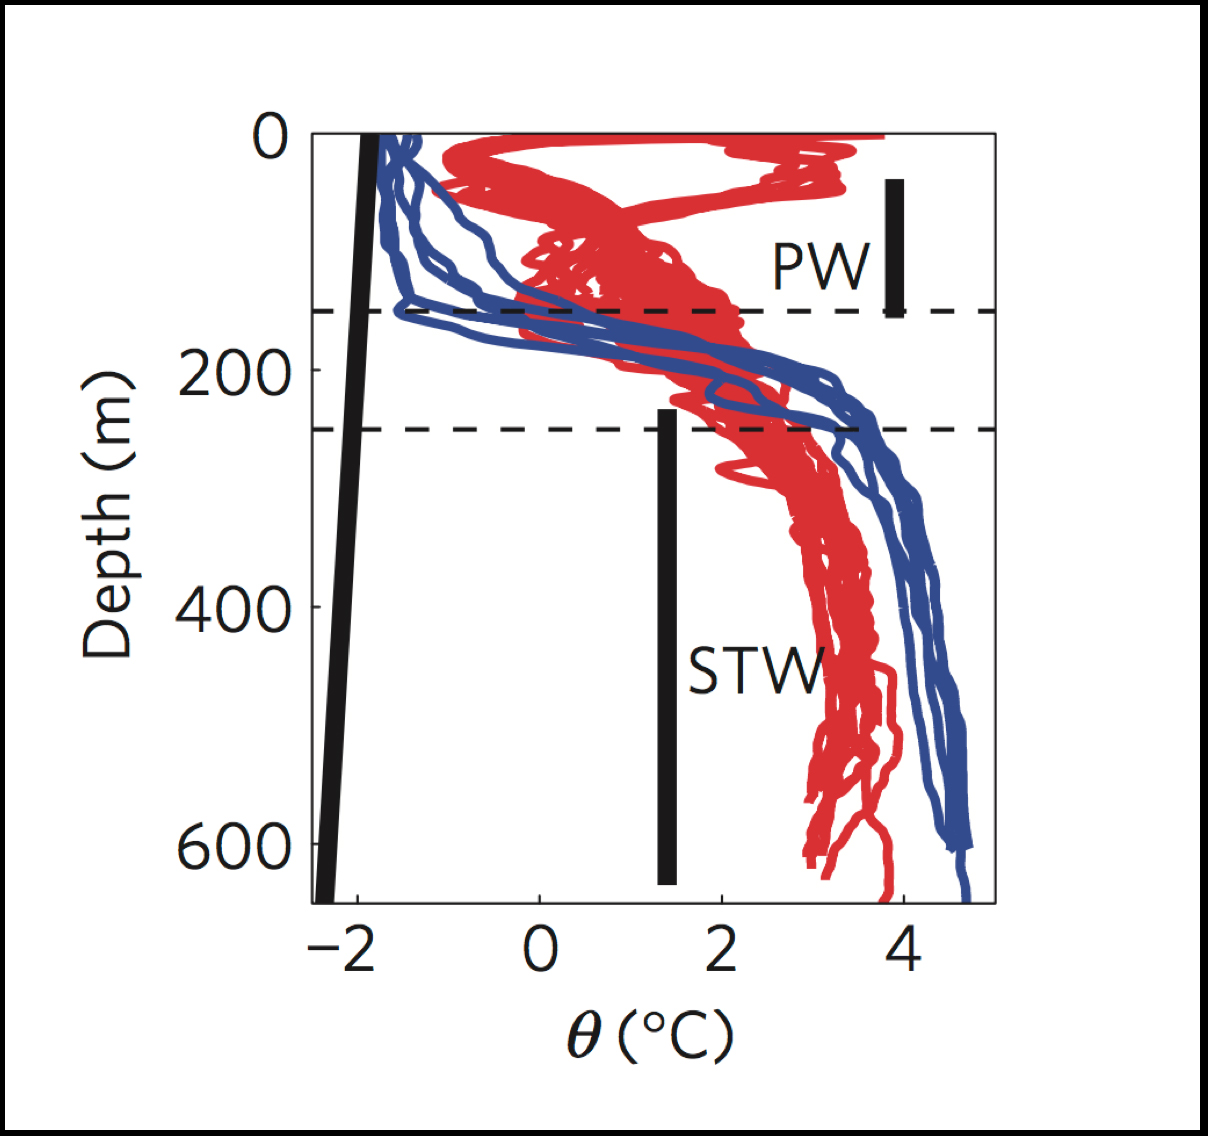
Figure 2A: Atlantic and Arctic waters in Sermilik Fjord (Nature Geoscience, Volume 4, 322-327, 20 MAR 2011 DOI: 10.1038/ngeo1109)
This figure reveals that water temperatures tend to be cooler at the surface and warmer at depth.
Naturally, this approach – of explaining science with datasets and figures – doesn’t work for a radio story. It’s a thorough representation of what’s happening with the glacier and in the fjord but a general audience won’t be able to connect to what’s being discussed.
So the question I had before starting my radio story was how do I take these science elements – these datasets – and work them into a story flow? In other words: