SWARM Data Activity #3
Diving into the Palmer Deep
You can also download this activity as a Word Doc: Data Swarm Activity #3.
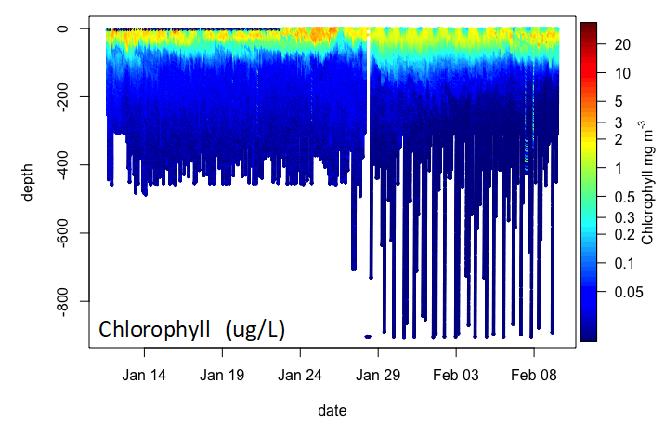
In the last dispatch, CODAR data revealed ocean surface currents within the foraging area of the penguins of Palmer studied in the SWARM project. This week we are going to dive below the surface to find where the penguins feed. Penguins feed on krill, krill feed on phytoplankton, phytoplankton use sunlight for food. During the summer in Antarctica, the phytoplankton population increases dramatically (measurements over 2 µg/L means large levels of phytoplankton), providing more food for krill, therefore more food for penguins. Phytoplankton, the base of the Antarctic food web, are affected by water temperature and salinity.
How do we know where the phytoplankton are?
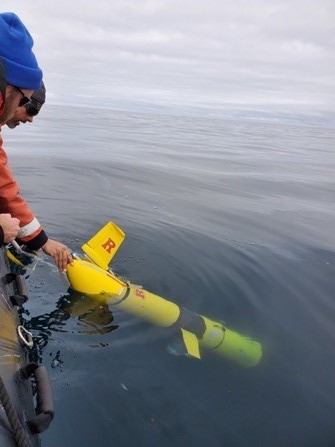
Similar to weather fronts seen on weather reports, there are fronts and eddies (circular movements or swirls of water) in the ocean. These fronts and eddies are created by the movement of water of different temperatures and salinity (saltiness). SWARM scientists have deployed three underwater robots in the Palmer Deep area. Scientists are coordinating the missions of three underwater robots to understand how the physics (temperature and salinity) and phytoplankton communities change in time and location in the Palmer Deep. Every few hours, each robot travels to the ocean surface to make a satellite phone call to share the collected data. That allows the scientists to see the data almost as quickly as it is collected so that the next glider missions can be adjusted to better understand where the conditions might be optimal for locating where the penguins might be feeding.
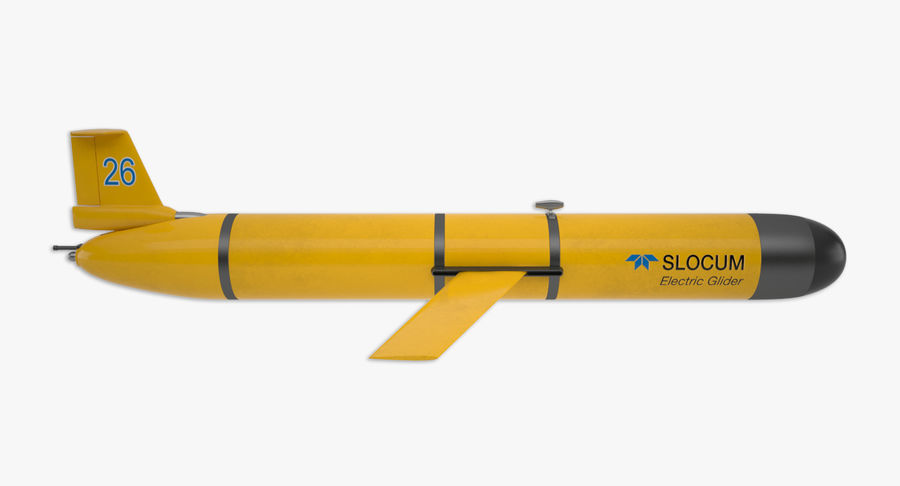
How do underwater robots work?
Underwater gliding robots operate by receiving commands through a satellite phone. The instructions tell the glider where to go in the ocean, how deep to dive, and what measurements to collect.
These robots do not have propellers. Instead they change their buoyancy to sink and climb through the ocean. They slowly move through the ocean collecting valuable ocean data every 2 seconds!
And speaking of data, check out the worksheet to see the data sets that are being collected in Antarctica right now by gliders.
Data Activity
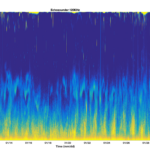
The following data sets are being collected in Antarctica right now by glider. (These data were collected from mid-January to early February of 2020.)
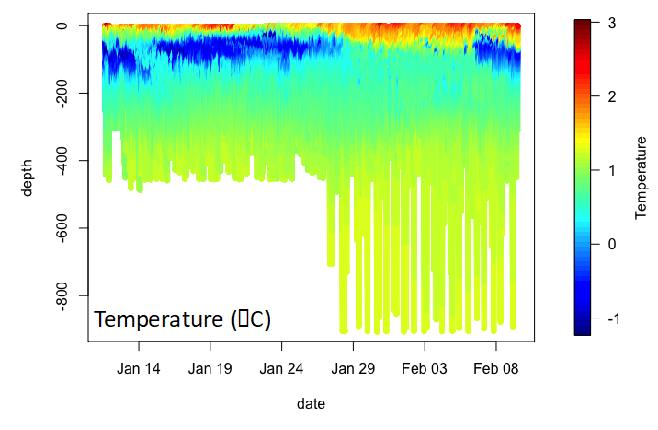
Temperature
Salinity

Chlorophyll
Review the glider data above collected from the Palmer Deep and answer the following questions:
1. Where are the largest differences in temperature, salinity and chlorophyll measurements? Near the surface (0 – 100 meters), or 100 – 400 meters, or 400 meters and deeper?
2. When did the highest concentrations of chlorophyll occur and at what depth did they occur?
3. During that same time and depth, what were the corresponding temperature and salinity readings? Given that information, what would you conclude about the conditions that phytoplankton like best?
4. Since strong winds can mix the ocean and make the water near the surface more uniform, when do you think the wind was strong enough to mix the cold water found near 200m deep with the surface?
This activity was developed as part of our Project SWARM series of data activities.