• About Us
  • Contact Us
Polar ICE
  • About Us
    • Polar CAP Team
    • Polar CAP Project
    • Polar-ICE Project
    • Mission & Goals
    • History of the Polar Literacy Principles
    • Motivation: Why a Polar Literacy Initiative?
    • How We Began
    • Contact Us
    • Publications
  • Polar Literacy Principles
  • Polar Data Education
    • Polar Data Stories
    • Science Investigations (Sci-I) Project
    • I.D. Antarctica
    • SWARM
  • Polar Research
    • Polar Scientist Cards
    • Polar Landscape
    • Photos/Video
    • Ask a Polar Scientist
  • Scientists
    • Looking for ideas for how to broaden the reach of your polar research?
    • Scientist Professional Development Opportunities
    • Science Communication Workshops for Scientists
    • The Art of Storytelling with Ari Daniel
  • Educators
    • Educator Professional Development Programs (2015-2019)
      • SWARM Workshop 2019
      • Science Investigations (Sci-I) Project Workshop
      • EARTH Workshops
      • Polar ICE Summit 2019
    • Student Polar Research Symposiums
  • Palmer LTER
    • Palmer LTER School Videoconference Archive
    • I.D. Antarctica
  • Polar Explorer Adventures
    • Data to the Rescue – Individual
    • Data to the Rescue – Club Version
  • Blog
  • Menu Menu

Investigation 2: Penguin Populations

You are here: Home1 / Polar Explorer Adventures2 / Data to the Rescue3 / Activity 4 – Penguins of Palmer4 / Investigation 2: Penguin Populations

Investigation 2: Penguin Populations

Now it is time to investigate the breeding pairs of penguins living in one location over time.  Let us explore a data set that looks at penguin populations (in breeding pairs) from 1979 to 2016. 

There are a few ways we can explore the data. One way is to explore it in an online data tool called – Common Online Data Analysis Platform (CODAP) for short. It is a free online tool that helps us create graphs to visualize data. The other is to explore our interactive data visualization. Choose one or both options below.

1. Explore the data with CODAP

Penguin Data in CODAP
CODAP Guide
CODAP Checklist

Interact with the penguin dataset in the CODAP viewer.

Download the checklist version of the CODAP guide.

Download the full booklet version of the CODAP guide.

Once you create a graph using CODAP take a screen grab image of it and save it or print it.

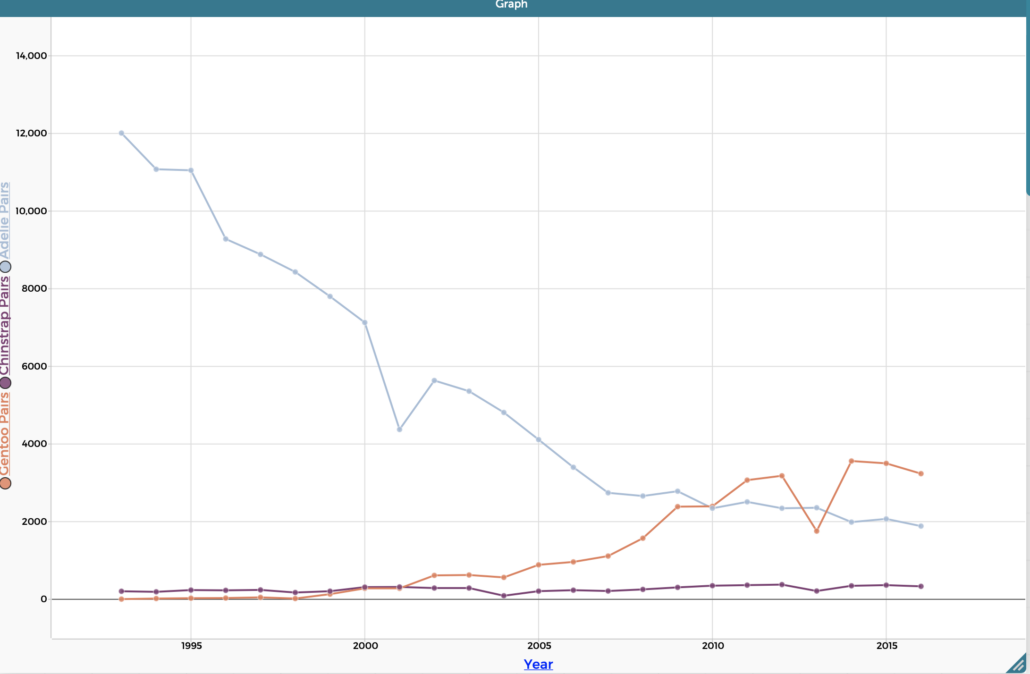
Now that you have created your graph it is time to analyze it. All three penguin species should be represented on the graph. Colors may vary but the trends should look like the graph below. If your graph is different, try to start over and remake the graph. 


2. Explore the Data Story

If you were unable to use CODAP do not worry! You can use the interactive graphing tool below to explore the numbers of penguin breeding pairs in the Palmer Research Station area of the Western Antarctica Peninsula from 1990 – 2016. Even if you did complete CODAP, still go through the data story below to get a better understanding of the data. It is helpful to look at data many ways!

 
❮ Previous Page
Next Page ❯
Polar Explorer Adventures
  • Data to the Rescue
    • Activity 1 – Pack Your Bags
      • Polar Regions
      • Packing for a Polar Expedition
      • What would you pack?
      • Climate Change at the Poles
      • The Arctic vs. the Antarctic
      • Hear From a Scientist Who Visited Antarctica!
    • Activity 2 – Diving into Data
      • Let’s Play a Card Game
      • How Do Scientists Collect and Share Data?
      • M&M Sorter & Simulator
      • Graphing M&M Data
    • Activity 3 – Penguins Need Our Help
      • Let’s meet Dr. Megan Cimino, Penguin Scientist
      • Locating the Research Site
      • Getting Started: What penguin are you today?
      • Let’s identify our study subjects… Penguins!
      • A Closer Look at Penguins
      • Investigation 1: Penguin Habitats
    • Activity 4 – Penguins of Palmer
      • Penguin Populations Over Time at Palmer
      • Investigation 2: Penguin Populations
      • How are the penguin populations changing?
      • What have we learned so far?
    • Activity 5 – Questionland
      • Welcome to Questionland!
      • Formulate your Question with your Group
      • Check in with Dr. Megan Cimino
      • Prioritizing your Questions
    • Activity 6 – Exploring Ice
      • Exploring Ice
      • Sea Ice and Climate Change
      • Investigation 3: Trends in Sea Ice Extent Data
    • Activity 7- Communicate Science with a Data Jam
      • Introduction to Data Jam
      • Creating a Data Jam: Step 1
      • Creating a Data Jam: Step 2
      • Examples of Ratios & Proportions
      • Ratios with Penguin Data
      • Create your Data Jam!
      • Make Change in Your Community
  • Ice Moves! 
    • Ellyn Enderlin – Glaciologist
    • Glacier Flow
    • How Do Glaciers Move?
    • How is Climate Change Impacting Glaciers?
  • Glaciers in Greenland 
    • Michalea King – Glaciologist
    • Studying the Earth with Satellites
    • Track Glaciers from Space!
    • The Fate of Pine Island
    • Dr. King’s Satellite Images
    • Understanding Glacial Retreat
    • Sketching Climate Change
  • Ancient Antarctica 
    • Stacy Porter – Glaciologist
    • Calculating the Age of a Glacier
  • Fire in the Arctic 
    • Introduction to Bianca
    • What does fire have to do with the Poles?
    • Satellite Images of the Boreal Forest
    • A Closer Look at Arctic Fires
    • The Effect of Fires on the Environment in the Arctic
    • Animals Impacted by Fire at the Poles
  • People in the Arctic 
    • Introduction to Bree
    • In the field – Archeological Dig
    • Join the Archeological Dig
    • Where would YOU dig and why?
    • Compare Your Dig Site Choice
  • Streams in the Dry Valleys 
    • Introduction to Chris
    • Iron, Phytoplankton, & the Carbon Cycle
    • Polar Food Webs
  • Lakes in the Dry Valleys 
    • Introduction to Rachael
    • What are Protists?
    • How do Living Things Get Energy?
    • Five Kinds of Protists
    • Build Your Own!

Acknowledgements

NSF Logo

This site was developed with the support of the National Science Foundation under Grant No. PLR-1525635 and PLR-1906897. Any opinions, findings, and conclusions or recommendations expressed in this material are those of the authors and do not necessarily reflect the views of the National Science Foundation.
© 2020 Rutgers University Polar Literacy Project - Enfold WordPress Theme by Kriesi
Scroll to top Scroll to top Scroll to top