SWARM Data Activity #1
In addition to our weekly I.D. Antarctica mysteries, this winter we are also happy to feature a series of data activities from Project SWARM.
Oceanographers from Rutgers University and the University of Delaware are currently staying at Palmer Station in Antarctica to investigate food web interactions. As part of this project, they will create a series of worksheets based on data they collect in their research. Each activity will focus on a part of the food web, including phytoplankton, krill and penguins. Activities are designed for middle school and high school students.
We hope you’ll follow along and try out the activities in your classroom!
What does springtime in the Antarctic look like?
This activity is also available as a Word Doc: Data Swarm Activity #1
Although you have probably never thought about the Polar Regions having seasons, the seasonal changes in temperature and light strongly affect polar food webs. The Data SWARM activities will follow research scientists currently in Antarctica at Palmer Station (a U.S. scientific research station) studying the impact of physical characteristics (temperature, light, salinity, etc) on the biology (chlorophyll, krill, penguins, etc) in Antarctica.
Antarctica
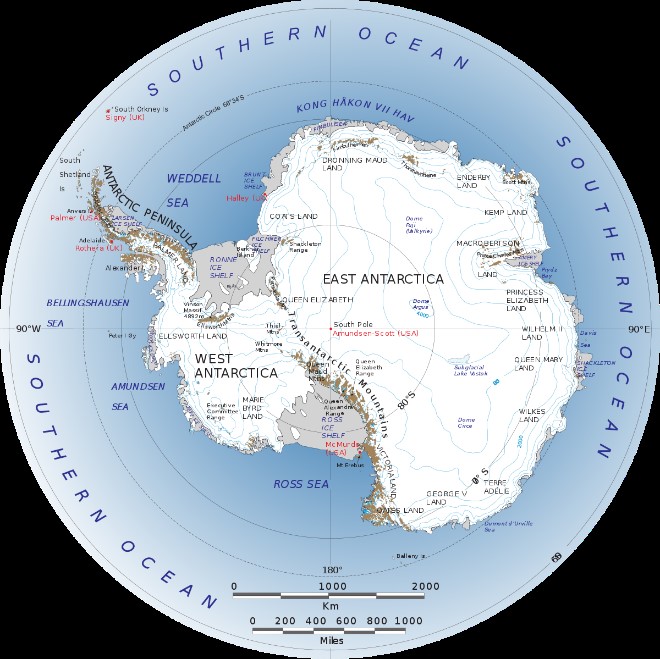
Palmer Station (red area on map)
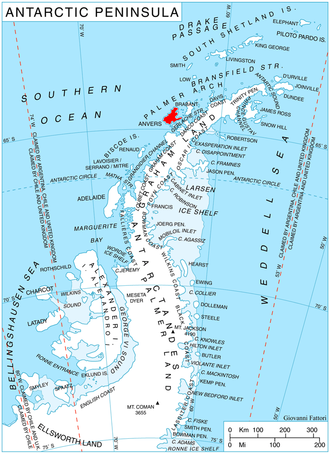
Specifically, the SWARM scientists will study a canyon off Palmer Station called Palmer Deep. Surrounding the Palmer Deep are several islands (Anvers, Joubin Islands – JOUB, Wilhelm Archipelago – WAUW, etc) that are important islands for penguin habitat.
The map to the right shows the locations of the study sites where the scientists will focus on collecting data. The stations range from 1 – 5, with 1 being closest to land and 5 the furthest away from land and directly over the deepest part of the canyon.

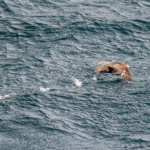
The scientists are in Antarctica now because it is springtime. Just as spring brings warmer temperatures, new plants and migrating animals where you live, there are similar “signals of spring” in the Antarctic. Over the next weeks, scientists will share different data collected that are important to the larger understanding of the food web during springtime and ecosystem of the area.
Temperature and Chlorophyll will be measured very frequently as part of the SWARM research project, as they are “signals of spring”. Just as you can detect levels of temperature in water by touch, ocean plants and animals can detect temperature and have preferences. As the water temperature becomes a bit warmer during the spring, plants and animals become more active.

Review the data above collected from the Palmer Deep and answer the following questions (The numbers in white across the top of the graphs are the station numbers (1 – 5, please see map above) where the data was collected):
1. What is the water temperature at the surface?
2. At 80m deep at Station 3?
3. At 150m deep over the canyon (Station 5)?
But what is Chlorophyll?
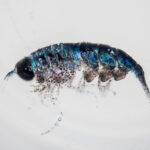
Different from what you may think of as plants on land, there are tiny plants floating in the ocean called phytoplankton. All plants, living on land or in the ocean, contain a green pigment called chlorophyll. Phytoplankton use chlorophyll to harvest sunlight for photosynthesis. Since scientists cannot count every tiny plant, they can use the measurement of chlorophyll as a “proxy” (one measurement is a replacement for another measurement) to understand the amount of plant life in the ocean.
The data below represents the concentration of chlorophyll in the water, reported in units of micrograms per liter of seawater (µg/L). A really high chlorophyll reading, meaning lots of plants floating in the water, would have concentrations of more than 2 µg/L. If there is no measurable chlorophyll, the concentration will be “0”.
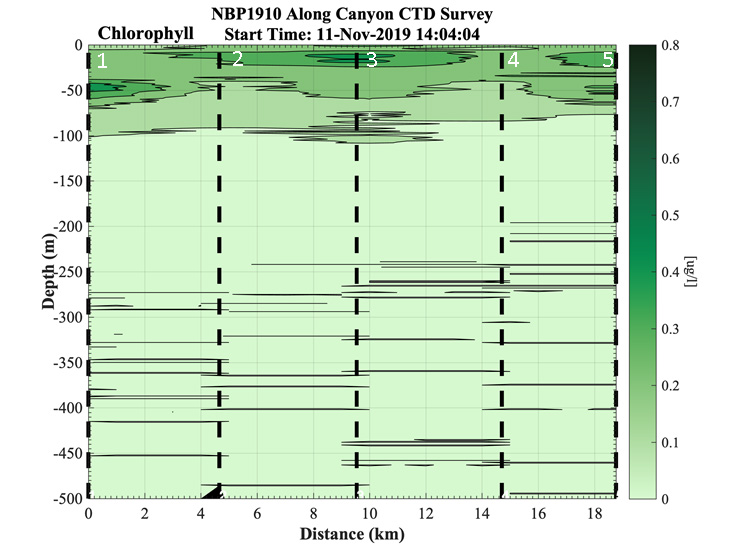
Review the data above from the Palmer Deep and answer the following questions (the numbers in white across the top of the graphs are the station numbers (1 – 5, please see map above) where the data was collected):
4. What is the phytoplankton concentration at 15 meters at Station 2?
5. Why do you think the phytoplankton concentration is “0” around 150m deep and below?