SWARM Data Activity #2
Where will the current take us?
You can also download this activity as a Word Doc: Data Swarm Activity #2.
In out last dispatch, we shared an overview of our SWARM research project. This week we are going to focus on an important measurement for our research, ocean currents and their speed and direction, because ocean currents directly impact the Antarctic food web. Ocean currents form fronts and eddies, similar to weather fronts you see in a weather report.
Wind and surface currents affect all objects on the surface of the ocean. The direction of surface current movement is the result of the interaction of many forces, including:
- salinity and density currents
- land and sea breezes
- tides
- gravity
- global rotation
SWARM scientists will use a technology called CODAR, or coastal radar, to measure the “ocean weather” to understand the amount of influence ocean currents have on the Antarctic food web.
How Does CODAR Work?
These coastal radars can measure currents over a large region of the coastal ocean, from a few kilometers offshore up to about 200 km, and can operate under any weather conditions.
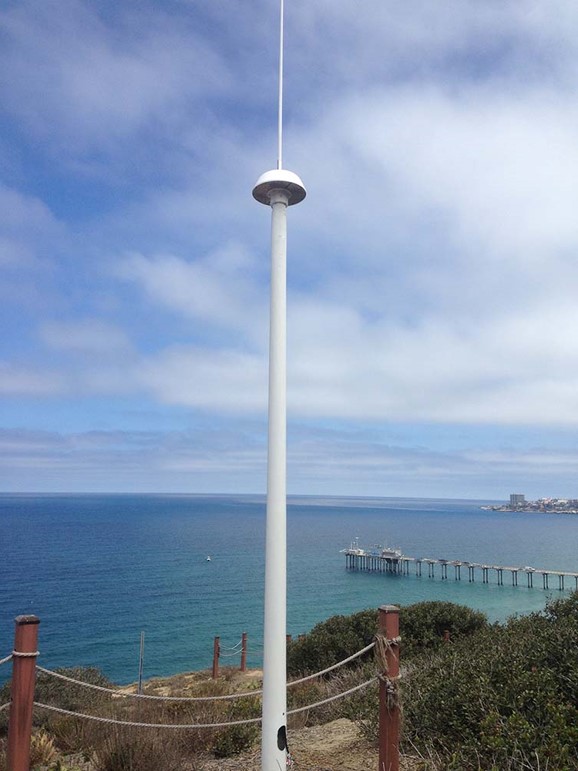
HF radar antennae are located near the water’s edge, and need to be situated atop a high point of land.
Each CODAR site has at least two antennas: the first transmits a radio signal out across the ocean surface and the second listens for the reflected radio signal after it has bounced off the ocean’s waves. By measuring the change in frequency of the radio signal that returns, the CODAR system determines how fast the water is moving toward or away from the antenna. The standard system can also determine the height and frequency of the waves near the shore.
However, each antenna site can only determine how fast the water is moving toward or away from that antenna. But the water might actually be moving away and to the right or left at the same time or, in other words, at an angle. Therefore, in order to determine the ocean’s actual direction, computers process measurements taken of the same spot of the ocean at the same time from two or three different antenna sites. Then the computers combine the readings to come up with the net direction of the ocean.
Once the speed and direction of an object are determined, it’s possible to predict where the object might be headed in the near future. By using vectors, each distance and time may be estimated or calculated with significant precision.
Using CODAR in Antarctica
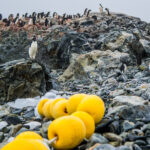
Specifically, the SWARM scientists will study a canyon off Palmer Station called Palmer Deep. Surrounding the Palmer Deep are several islands (Anvers, Joubin Islands – JOUB, Wauwermans Islands – WAUW, etc) that are important islands for penguin habitat.
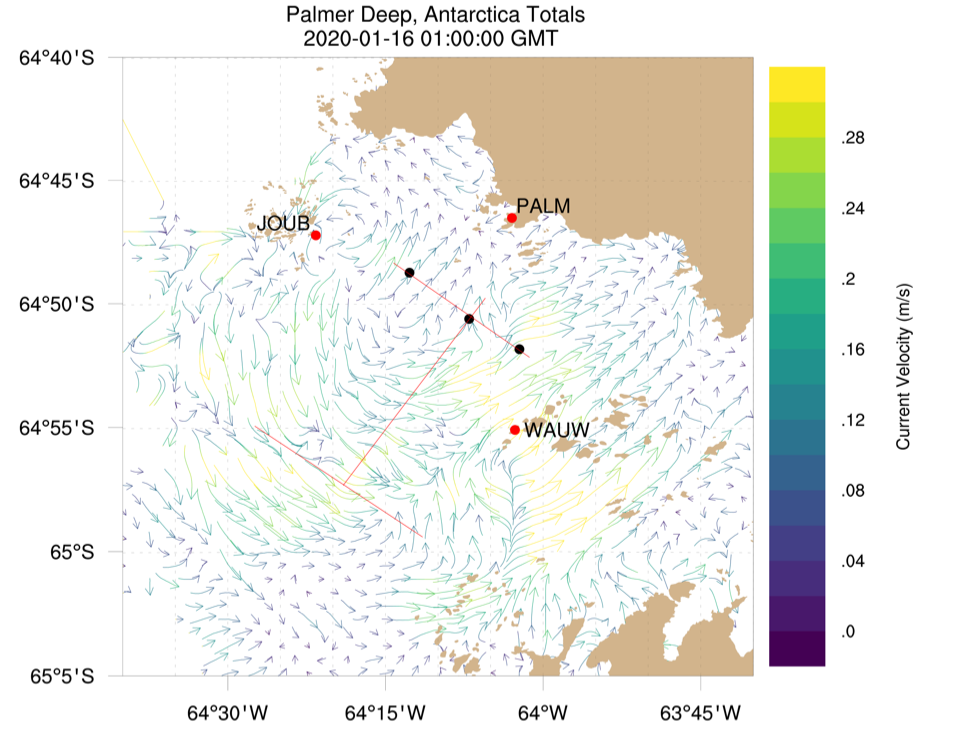
The map to the right shows the locations of some of the ocean technologies SWARM will deploy this season. The red dots on the map are the locations of CODAR sites. More on that later. The other technologies we will discuss in future weeks include underwater robots along the red lines and three moorings indicated by the black dots.
The CODAR system SWARM deployed in the Antarctic is an excellent tool to map the currents of the surface ocean. In Palmer Deep it requires three sites. One at Palmer Station (PALM), one in the Joubin Islands (JOUB), and one in the Wauwermans Islands (WAUW).
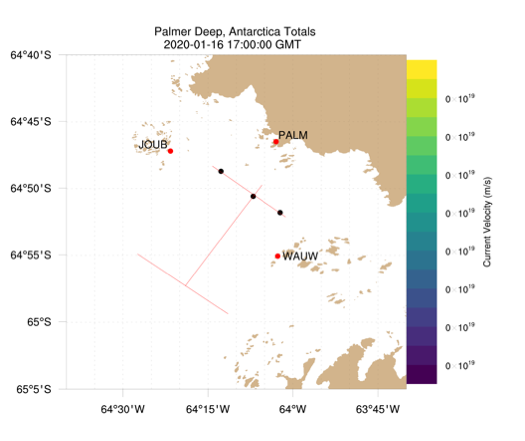
Once the information from all three sites is combined we can generate a map of ocean currents. The vectors (arrows) on this map indicate the speed and direction of the ocean currents.
Review the CODAR data above collected from the Palmer Deep and answer the following questions:
1. Are the fastest currents near the PALM location, the JOUB location or the WAUW location?
2. Are the slowest currents near the PALM location, the JOUB location or the WAUW location?
3. Are the currents moving toward or away from the shore where Palmer Station (PALM) is located?
4. Plankton and krill are not able to “swim” against strong currents. As a result, they are pushed along by ocean currents. Given that information, where do you think you will find the largest concentration of plankton in krill?
- 65°5’S by 64°30’W
- 64°55’S by 63°45’W
- 64°45’S by 64°15’W
- 64°55’S by 64°15’W
5. Since penguins like to eat krill, identify (using longitude and latitude coordinates) three areas where penguins might like to hunt for krill.
This activity was developed as part of our Project SWARM series of data activities.