How Do Scientists Collect and Share Data?
Scientists cannot do their jobs alone. Collaboration and communication are key skills. You will go through an M&M simulation to find out how data can be collected and why it is important to communicate with other people.
But first, let’s make some predictions using the candy M&M’s as an example. Click through the M&M Predictions slides below to get started!
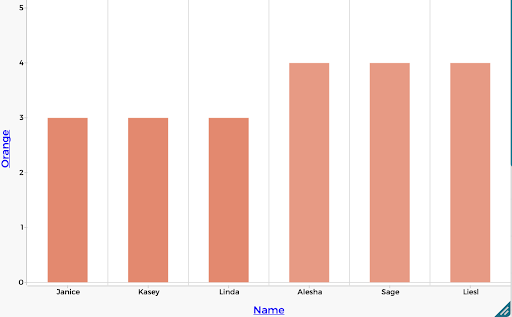
Soon, you are going to collect your own M&M data, but first take a look at ours in the graph below and answer the questions underneath.
Sort your M&Ms
If you have a fun size bag of M&Ms open it and count the number of each color.
Make sure to count and write down how many M&M’s of each color are generated, you will need this data for the next activity.
Graphing your M&M Data
Now that you have your M&M data, you can share it with other people.
CODAP is a free online tool that lets scientists like you easily create graphs of the data they collect. Making graphs can help you interpret your data.
For this activity, we started collecting an M&M dataset, but you are going to finish it! Click on the button below to open the CODAP application.
Then, using your M&M data, enter the number of each color you counted by clicking on the correct box in the “You!” row and typing in the number.
After all numbers are in, hit the “Enter” or “Return” button. The graph should update with your data.
To change the graph and to look at different colors, click the name of the color in the chart and drag it to the right side of the graph. As you do this, a yellow highlight should appear. When the highlight appears, let go and watch the graph update.
When are you have completed working in CODAP, click through the slide questions below to complete this activity.