Investigation 3: Trends in Sea Ice Extent Data
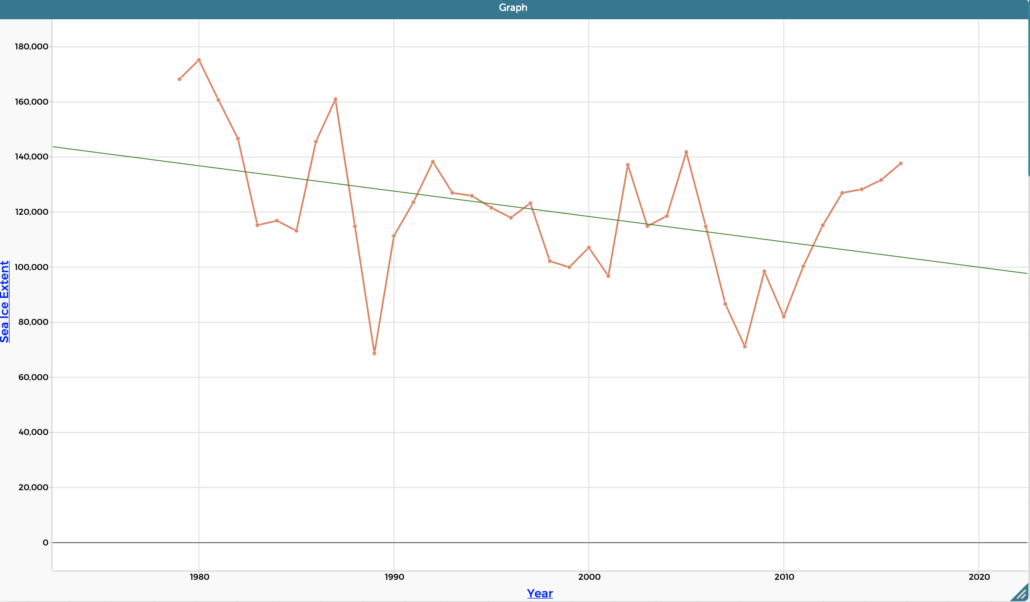
The graph below shows the sea ice extent (that is, the surface of ocean covered by ice) around the West Antarctic Peninsula (WAP) from 1980-2016.
The orange line represents the sea ice extent each year.
The green line represents the trend in the amount of sea ice over time.
As Ashley said, sharing your research is a really important step. How will you share what you have learned with others?
Next stop, Data Jam!
Collect Your Badge
Congratulations, you have finished the Exploring Ice activity! You can now collect your fifth Data to the Rescue badge. Download or print the badge to add it to your virtual or physical notebook collection.